 |
 |
| |
SiGlaz
INTELLIGENT DEFECT ANALYSIS SOFTWARE
[click
here]
|
|
| |
|
|
SiGlaz
Intelligent Defect Analyzer
Advanced Signature Analyzer
[click
here] |
|
| |
|
|
|
|
|
| |
| |
Spatial
signature analysis (SSA) is one of the
key technologies that semiconductor manufacturers
will begin to deploy into their manufacturing
processes in order to improve yield learning.
In order to perform rapid root cause analysis
of process excursions the defect signature
information derived from SSA must be integrated
with other data bases in the fab. However,
some of the fundamental impediments to
integrated data management identified
in the 2003 Sematech International Technology
Roadmap for Semiconductors (ITRS) are
a lack of standards on which to base system
communications, standard data formats,
and a common software interface between
data depositories. “The ability
to automate the retrieval of data from
a variety of database sosurces, such as
based on statistical process control charts
and other system cues will be required
to efficiently reduce these data sources
to process-related information in a timely
manner. To close the loop on defect and
fault sourcing capabilities, methods must
be established for integrating workflow
information (such as WIP data) with the
DMS, particularly in commercial DMS systems.”
SiGlaz has introduced
a spatial signature analysis product called
Intelligent Defect Analysis (IDA) that
automatically assimilates manufacturing
process data collected from inspection
equipment and other fab databases to determine
the root-cause of a process excursion.
IDA incorporates an advanced system framework
that facilitates communication between
dissimilar databases and moves beyond
the operator-driven paradigm that is currently
used in the fab to an event-driven paradigm
that is emerging in advanced process control
systems. SiGlaz uses artificial intelligence
methods that combine both spatial and
temporal elements in its signature analysis.
The method deploys a teaching algorithm
and data mining to emulate the domain
expert in recognizing anomalies occurring
during the wafer manufacturing process.
This paper will describe both the architecture
and components of this automated process
control technique.
|
|
Intelligent
Defect Analysis is designed around an
event-driven methodology, as represented
by the learning cycle diagram shown in
Figure 1. The steps of the learning cycle
can be applied to any inspection process
that takes place in the fab; from optimizing
process results on a single piece of equipment
to managing equipment maintenance schedules.
The fundamental point as it applies to
IDA is that the architecture allows the
data taken by the inspection equipment
leads immediately and automatically to
information through knowledge discovery
and root cause analysis with little or
no need for trained staff to bridge various
software systems to create the information.
Likewise, IDA software automatically organizes
the information to trigger an action that
closes the learning cycle. Some examples
of the actions that could be taken are:
an email to alert the fabrication engineer
to a probable yield loss condition; or
an instant wireless message to call support
for unscheduled preventive maintenance.
As the industry moves toward advanced
process control (APC) it is also possible
the IDA could issue a feedback or feed-forward
command via “Interface A”
to optimize a process tool. The SEMI Equipment
Data Acquisition (EDA) specifications,
also known as “Interface A”
(published in March 2005), provide the
semiconductor manufacturing industry with
a complete suite of software interface
definitions that support the guidelines,
and define the next generation of data
acquisition for the equipment. IDA framework
deploys the same industry standards designed
to simplify the connection and integration
of systems.
|
 Figure 1 Learning
Cycle
Figure 1 Learning
Cycle
|
In
order to deploy the event-driven methodology
in the fab, it is important to consider
the advantages of a service-centered architecture
that is the essential to modern distributed
systems. Over the past several years,
the system development process has evolved
from a process-centric paradigm to a period
of data-centrism, and finally, to the
new service-centric view of information
management. The service-centric paradigm
has a significant advantage over the traditional
methods in the sharing and re-using of
the software components for different
processes and for different data models.
IDA is a suite of products
that has been designed from the ground
up with a clear service-oriented architecture.
It provides a scaleable, reliable, secure
interface for both external and internal
systems. There are four primary service-centric
functions: 1) Analysis Services; 2) Construction
Services; 3) Deployment Services; and
4) Report Services. Analysis services
provide the fundamental autonomous software
algorithms to analyze and characterize
spatial signatures and to classify and
train known defect signatures for use
in pattern recognition. Construction services
contribute all components for the assembly
of a neural network or workflow for an
analysis job. Deployment services provide
all components for launching and monitoring
process analysis jobs in a safe and recoverable
environment on the manufacturing floor.
The Report services provide all functionality
relating to extraction, transformation
and loading of spatial and temporal data
collected during manufacturing into the
data warehouse, including the construction
of multi-dimensional cubes for using in
advance queries and reporting and the
data mining services.
|
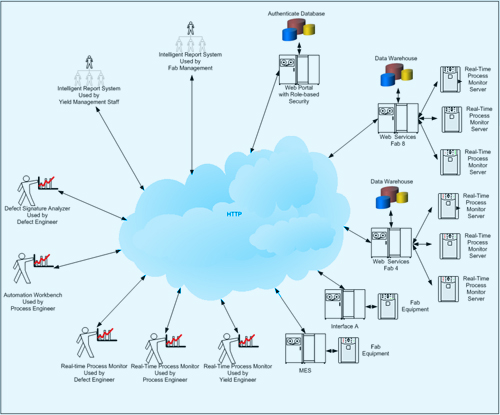 Figure 2 Integrating
IDA Architecture into a fab environment
Figure 2 Integrating
IDA Architecture into a fab environment
|
|
| IDA is composed
of four applications modules: |
- |
Defect
Signature Analyzer provides yield
engineers with a wide range of analysis
and visualization tools with which
to develop and optimize the signature
analysis methodology and to train
the defect signature library.
|
|
- |
Automation
Workbench allows engineers to
automate the signature analysis methodology
to run the recipe in either batch
mode or continuous monitor mode.
|
|
- |
Real-Time
Process Monitor schedules,
executes and monitors multiple AWB
recipes in a production environment.
A dashboard-type display indicates
the status and real-time results
from each of the operating recipes.
|
|
- |
Intelligent
Reporting System generates a
data base of analysis results. It
uses On Line Analysis Process (OLAP)
to analyze signature analysis results
over an extended time period in order
to identify cyclical trends in production
data.
|
|
|
All
four applications modules share the same
components and services; DSA uses only
one type of service while RPM uses all
four services.
Getting legacy platforms to work together
is one of the major tasks of the Information
Technology group in every fab. Adding
a new capability, such as spatial signature
analysis, is often seen as desirable from
a yield learning perspective, but is often
seen as impractical from an integrated
data management perspective. One of the
key features of SiGlaz IDA is its ease-of-integration
into a cross platform manufacturing environment.
The fundamental requirement is to adopt
a framework that enables the many different
operating systems and databases to communicate
with each other in a seamless, reliable
and efficient manner. Figure 2 shows how
IDA may be integrated into a fab environment
using the .NET framework.
SiGlaz has adopted the Microsoft .NET
Framework for its IDA product. The .NET
Framework is a development and execution
environment that allows different programming
languages and libraries to work together
seamlessly to create Windows-based applications
that are easier to build, manage, deploy,
and integrate with other networks and
operating systems.
The .NET Framework provides the basic
infrastructure that SiGlaz IDA applications
require in order to make the connection
of information, people, systems, and devices
a reality:
|
• Support
for standard networking protocols &
specifications: The .NET Framework
uses standard Internet protocols and
specifications, like TCP/IP, SOAP, XML,
& HTTP, to allow a broad range of
information, people, systems, and devices
to be interconnected.
• Support for different
programming languages: The
.NET Framework supports a variety of
different programming languages so developers
can select the language that is best
suited for their application.
• Support
for programming libraries developed
in different languages: The
.NET Framework provides a consistent
programming model for using prepackaged
units of functionality (libraries) which
makes application development faster,
easier & cheaper.
• Support for different
platforms: The .NET Framework
is available for a variety of platforms,
which allows people, systems, and devices
to be connected using different computing
platforms.
|
| The .NET Framework
consists of two primary components: |
• The
Common Language Runtime (CLR):
A language-neutral development &
execution environment that provides
services to help "manage"
application execution
• The Framework
Class Libraries (FCL): A consistent,
object-oriented library of prepackaged
functionality
|
 Figure 3
 . NET Framework
|
Figure
3 shows that IDA classes are integrated
with the .NET Framework to work with different
interfaces, providing a growth path to
higher levels of fab integration; IDA
classes are the re-usable software components
that collaborate to provide the services
to support SiGlaz applications modules.
The first generation
of IDA software is designed in the .NET
framework around the “Windows Forms”
architecture. In this traditional desktop
architecture, the operating system components
that manage windows and controls have
been assembled as the first level of hierarchy
in the .NET framework. The next generation
of IDA software will leverage the .NET
architecture by using the “Web Forms”
architecture, which utilizes the internet
and http protocol to provide more distributed
interfaces using thin client. As “Interface
A” becomes more widely adopted by
semiconductor equipment vendors, the “XML
Web Services” architecture will
enable IDA to collaborate with other systems,
equipment and applications in the fab
using its web services.
IDA is built with the
SEMI Equipment Data Acquisition (EDA)
specifications in mind, also known as
“Interface A”. The specifications
are based on Web Services technologies.
Web Services are emerging as the industry
standards designed to simplify the connection
and integration of systems. Web services
enable the deployment of secure, discoverable,
platform-independent data collection and
management services that operate independently
of the job control interface to equipments,
and which can provide a quick way to access
data.
Web Services will become
the “lingua franca” or universal
language in the future fab for data exchange.
The first generation of IDA will alarm
or notify fab personnel via email, pager
or PDA when a process excursion is detected.
The next generation of spatial signature
software will be able to collaborate with
other equipment in sequence to create
a more complex root-cause analysis strategy,
including automatically exchanging knowledge
to self-correct using web services as
the vehicle of exchange. The following
steps illustrate a typical scenario for
automated root cause analysis in a future
fab:
|
1. Detect spatial signature
that indicates a process excursion has occurred.
2. Send request to various equipment involved
in the process using web services.
3. Receive parametric data related to equipment
health via web services data exchange
4. Determine the root-cause and prescribes
corrective actions.
|
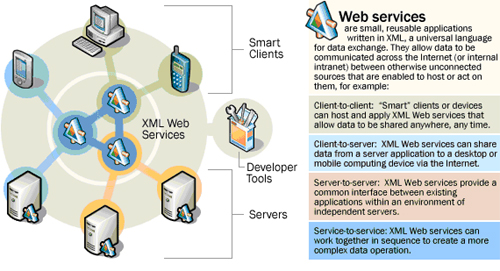 Figure 4 Web Services
|
|
The
IDA architecture has been designed to
operate in a cross-platform environment
using an open data integration platform.
It is an unbiased and tool-neutral system
makes use of heterogeneous data collected
from every step of the manufacturing process.
The input data for IDA may be accessed
directly from an inspection or process
tool or from a data base management system.
See Figure 5.
As semiconductor fabrication
processes continue to increase in complexity,
the IDA open data integration platform
can be adapted to handle the increased
volume and complexity of the data. For
example, as new defect detection tools
with higher resolution are introduced
into the process, the number of pixels
per unit area of wafer and the number
of process levels to be inspected will
result in a major increase in the volume
of the data. As high resolution digital
images from e-beam and x-ray inspection
systems introduce additional complexity
into the process of extracting and recognizing
spatial signatures. Increased use of integrated
metrology and integrated inspection systems
will generate so much data that it can
no longer be analyzed manually.
Integrated data management
applications like automated process control
and equipment sustaining operations are
critically dependent on timely access
to equipment parametric data. SiGlaz has
designed its system to enable improved
access to fine-grained equipment process
and operational data.
|
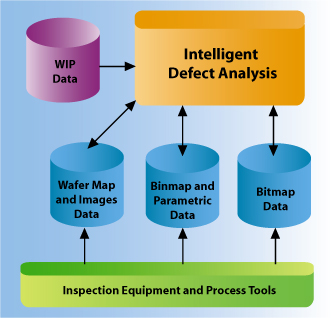 Figure 5 Heterogeneous
data sources
Figure 5 Heterogeneous
data sources
|
During
the course of monitor and analyzing wafer
inspection results files, IDA correlates
the defect signature information that
has been extracted from results files
(metadata) with other manufacturing data.
To utilize this information to support
yield enhancement and rapid yield learning
it is important that these data be consolidated
and organized in a data warehouse. The
data warehouse contains the living history
of the wafer processing steps within the
fab. The data may be collected from a
variety of heterogeneous sources such
as spatial analysis results from IDA (See
Figure 5), defect data from defect detection
tools, WIP, equipments, bin data, electrical
test, SPC and MES. A data warehouse combines
this data, cleanses it for accuracy, conforms
the data to dimensions, and organizes
it for ease and efficiency of querying.
|
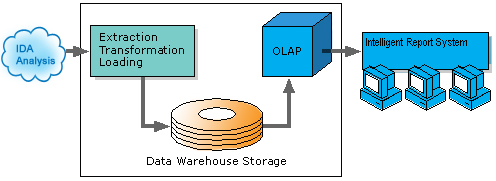 Figure 6 Data Warehouse
and OLAP
Figure 6 Data Warehouse
and OLAP
|
After
the data warehouse is populated with data,
yield and defect engineers can mine the
data to support yield learning. One of
the SiGlaz IDA software modules, called
Intelligent Reporting System, performs
spatial and temporal analysis of the IDA
metadata base to reveal trends in the
process. Online Analytic Process (OLAP)
is a popular tool for both temporal and
multi-variable analysis. OLAP technology
enables signature or spatial map data
to be used effectively for online analysis,
providing rapid responses to iterative
complex analytical queries. OLAP's multidimensional
data model and data aggregation techniques
organize and summarize large amounts of
data so it can be evaluated quickly using
online analysis and graphical tools. The
answer to a query into historical yield
data often leads to subsequent queries
as the analyst searches for answers or
explores possibilities. OLAP systems provide
the speed and flexibility to support the
analyst in real time.
Cubes are the main objects
in online analytic processing (OLAP),
a technology that provides fast access
to data in a data warehouse. A cube is
a set of data that is usually constructed
from a subset of a data warehouse and
is organized and summarized into a multidimensional
structure defined by a set of dimensions
and measures. See the table below.
|
Sample
Analysis Cube |
Column
Name |
Description |
Type |
| STEPID |
This
field will store the process
step in the Fab |
Dimension |
DEVICEID
|
The
name for the product being inspected |
Dimension |
| LOTID
|
Lot
identification |
Dimension |
| WAFERID |
Wafer identification |
Dimension |
| SLOTID |
Slot
Identification |
Dimension |
| RESULTDATE |
Date
of the inspection that produced
this results |
Dimension |
| RESULTTIME |
Time
of the inspection that produced
this results |
Dimension |
| MAPTYPE |
Signature;Scratch;Repeater;Micro-Scratch |
Dimension |
| MAPSUBTYPE |
User
Defined Signature name; Scratch
name |
Dimension |
| NDIE |
Number
of all inspected dies in wafer |
Measure |
| NDEFECT |
Number
of all defects in wafer |
Measure |
| NDEFDIE |
Number
of defected dies |
Measure |
| NDEFECTMAP |
Number
of defects in map type |
Measure |
| NDEFDIEMAP |
Number
of defect dies in map type
|
Measure |
|
|
1. Dimensions are a structural
attribute of cubes. They are organized
hierarchies of categories and (levels)
that describe data in the fact table (spatial
signature map). These categories and levels
describe similar sets of members
upon which the user wants to base an analysis.
2. In a cube, a measure is a set of values
that are based on a column in the cube's
fact table and are usually numeric.
In addition, measures are the central
values of a cube that are analyzed. That
is, measures are the numeric data of primary
interest to end users browsing a cube.
The measures you select depend on the
types of information end users request.
Some common measures are number of defects,
number of defected dies…See Figure
6
|
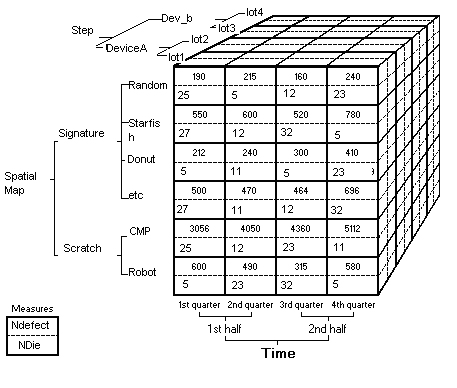 Figure 7 OLAP Cube
with Dimensions and Measures
Figure 7 OLAP Cube
with Dimensions and Measures
|
|
Automated
yield enhancement tools that perform rapid
manufacturing defect sourcing to identify
the root cause of a process excursion
are becoming a requirement as semiconductor
devices and processes are become more
complex. By merging spatial signature
analysis, data warehouse and data mining
into a single package, SiGlaz Intelligent
Defect Analysis software provides a fully
integrated solution to spatial and temporal
signature defect analysis. IDA has been
designed from the ground up to meet both
current and future fab requirements for
integrated data management. Its open data
architecture integrates easily with all
other systems and equipment on the manufacturing
floor and it supports the advanced requirements
of Interface A. A service-oriented architecture
and .NET Framework have positioned it
to meet future fab needs as the requirement
to handle increasingly higher data volumes
and more complex data formats. It is an
architecture that will support advanced
requirements for integrated data management
well into the future. |
| |
|
Please refer to INTELLIGENT
DEFECT ANALYSIS, Framework For Integrated
Data Management for Pdf file
of this page. |
|
|
|
|
| |
|